How to merge histogram bins (edges and counts) by bin-count condition?
Question:
- See the stacoverflow question How to merge histogram bins (edges and counts) by bin-count condition?
My answer to this question
I met this problem in my own reserach project, so I searched this question and posted my answer, hoping to help others and myself for reviewing.
- See my answer:
Assume the current histogram hist and bins bin_edges are returned by np.hist() function, and we want to merge small bins (i.e., the value of hist is smaller than some threshold) to larger ones, the code is shown below, where inputs are current hist and bins, and outputs are the new ones.
def merge_hist_bins(hist, bin_edges, \
    hist_value_thred = 1, # i.e., 1% if is_percentile True;
    is_percentile = False
    ):
    total = np.sum(hist)
    if is_percentile:
        hist_thred = int(total*hist_value_thred*0.01)
    else:
        hist_thred = int(hist_value_thred)
    print ("[***] hist_thred = ", hist_thred)
    assert len(hist) == len(bin_edges) - 1
    bin_dict = {}
    i_rightmost = 0
    for i in range(0, len(hist)):
        if i < i_rightmost:
            continue
        edge_left = bin_edges[i]
        j = i
        tmp_hist_sum = 0
        while tmp_hist_sum < hist_thred and j < len(hist):
            tmp_hist_sum += hist[j]
            j += 1
            edge_right = bin_edges[j]
        else:
            bin_dict[(edge_left, edge_right)] = tmp_hist_sum
        i_rightmost = j

    idx = 0
    new_hist = []
    new_bin_edges = [bin_edges[0]]
    for k , v in bin_dict.items():
        new_hist.append(v)
        new_bin_edges.append(k[1])
        print ("key {} : {}".format(k, v))
        idx += 1
    print ("[***] done, hist_thred = ", hist_thred)
    print ("[***] old bin # = {}, new bin # = {}".format(len(bin_edges), len(new_bin_edges)))
    return np.array(new_hist), np.array(new_bin_edges), hist_thred
We will show the histogram with the following function:
def show_hist(bin_edges, hist, fig_file = None):
    d_min = bin_edges[0]
    d_max = bin_edges[-1]
    d_num = len(bin_edges)
    fig, ax = plt.subplots()  #create figure and axes
    plt.hist(x=bin_edges[:-1], bins=bin_edges, weights=hist)
    plt.xlabel('Value')
    plt.ylabel('Frequency')
    plt.title('My Very Own Histogram')
    # Figure size in inches (default)
    plt.text(x=0.5, y=0.5, \
        s=r'$D_{min}=$'+"{}".format(d_min) + r', $D_{max}=$'+"{}".format(\
            d_max) + r', $D_{num}=$'+"{}".format(d_num),
        transform=ax.transAxes)
    if fig_file:
        plt.savefig("./results/{}.png".format(fig_file))
        print ("saved ", "./results/{}.png".format(fig_file))
    plt.show()
    txt_fn = "./results/" + npz_file + ".csv"
    comment = "#right_bin_edge, hist_value"
    file_lists = [ "{},{}".format(i, j if j > 50 else 0.5) for (i,j) in zip(bin_edges[1:], hist)]
    file_lists = [comment] + file_lists
    write_to_file(txt_fn, file_lists)
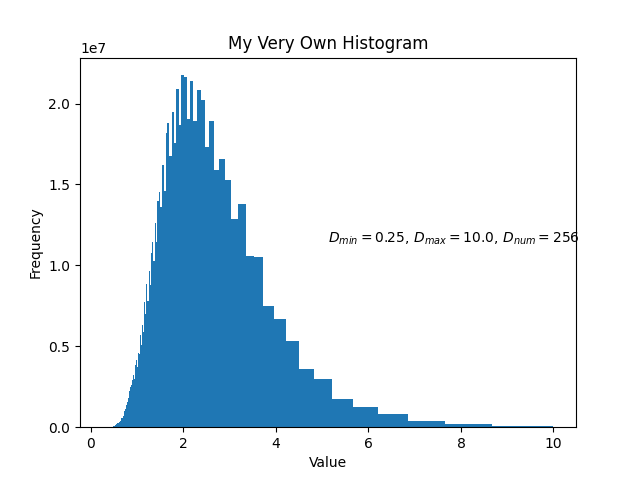
See the histogram before

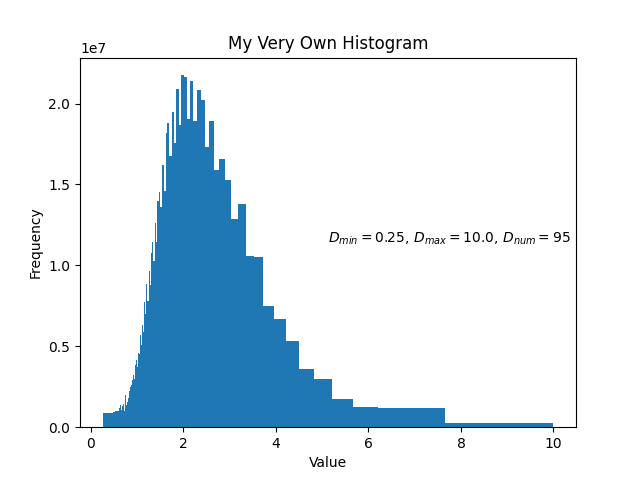
and after

the bin merging. In this example, input hist bin number is 256, new hist bin number is 95, with the threshold being 12% of sum(hist).
Complete Code
- See the complete code here